Prolytic Project Management Dashboard: Redefining Visual Workflow Intelligence
Project management has moved far beyond simple to-do lists and Gantt charts. Modern teams require a visual command center that consolidates tasks, timelines, team capacity, and real-time progress into a single, coherent interface. The Prolytic Project Management Dashboard addresses this need with a design philosophy rooted in clarity, adaptability, and professional-grade aesthetics. Whether you are a startup founder tracking product milestones, a marketing agency managing multiple client campaigns, or a research team coordinating data collection phases, the way you visualize work directly impacts how effectively you execute it. This article explores the design decisions, practical advantages, and real-world applications of the Prolytic dashboard template, with a focus on what makes it a compelling choice for teams seeking structure without sacrificing flexibility.
From Static Boards to Intelligent Command Centers
The evolution of project management tools reveals a consistent pattern: early solutions prioritized function over form, while modern platforms understand that interface design is inseparable from productivity. A cluttered, poorly organized dashboard introduces cognitive friction, forcing users to hunt for information instead of acting on it. The Prolytic Project Management Dashboard takes a deliberately different approach. It treats the dashboard as a decision-support environment, not merely a list of tasks. Every visual element — from progress bars to team avatars to timeline blocks — is positioned to reduce scanning time and highlight what needs attention. This shift from passive reporting to active workflow intelligence is what distinguishes a genuinely useful dashboard from a decorative one.
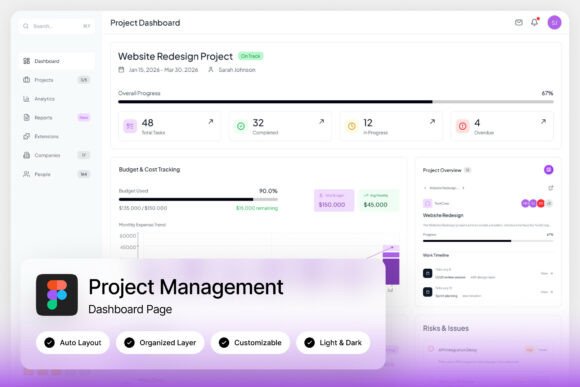
For example, a product manager overseeing a software release cycle can glance at the Prolytic dashboard and immediately see which features are on track, which are blocked, and how team members are allocated across sprints. The layout groups related data without overwhelming the viewer, using whitespace and typography to create a natural reading order. This is not just about looking professional; it is about reducing the mental load of project oversight so that managers can spend more time on problem-solving and less on data extraction.
Dual-Mode Interface: Light and Dark as Functional Tools, Not Aesthetic Options
One of the standout characteristics of the Prolytic Project Management Dashboard is its inclusion of both light and dark mode interfaces. Many templates offer this as a cosmetic toggle, but here the design implications run deeper. In a light mode setting, the dashboard uses crisp, high-contrast backgrounds that work well in brightly lit offices or on tablets used during stand-up meetings. The dark mode, on the other hand, is engineered for extended screen time — common among project managers who spend hours monitoring dashboards, updating task statuses, and reviewing timelines. Dark mode reduces eye strain in low-light environments and makes color-coded priority tags and progress indicators pop more vividly.
Beyond personal preference, the dual-mode capability supports team diversity. Not every member works under the same lighting conditions or has the same visual sensitivity. By offering both modes in a single Figma file, the Prolytic template allows organizations to standardize on one version or let individuals choose. This flexibility is especially valuable for distributed teams where some members work from co-working spaces, some from home offices, and others from coffee shops. A dashboard that adapts to the user’s environment rather than forcing the user to adapt to the dashboard is a small but meaningful step toward inclusive tool design.
The 1440×1024 Pixel Standard: Why Resolution Precision Matters
The Prolytic Project Management Dashboard is built at a resolution of 1440×1024 pixels. This is not an arbitrary dimension. It reflects a common screen size used across laptops and external monitors, particularly among professionals who run project management software alongside communication tools, code editors, or design applications. Designing at this resolution ensures that the dashboard displays without excessive scrolling or awkward truncation on the majority of workplace displays. For teams that present dashboards on larger screens or projectors, the layout scales predictably because the underlying grid system is built for consistency.
Pixel-perfect layout also means that elements such as status badges, progress rings, and timeline bars align precisely. When a team member sees a progress indicator at 75%, that visual representation corresponds exactly to the underlying data. In practice, this precision reduces misinterpretation. For instance, a stakeholder reviewing a sprint report during a weekly meeting can trust that the visual status matches the actual completion percentage. This alignment between visual design and data fidelity is critical for maintaining credibility in reporting workflows.
Customization Through the Figma Ecosystem
A project management dashboard is rarely deployed as a one-size-fits-all solution. Teams have unique naming conventions, priority scales, milestone structures, and reporting cadences. The Prolytic Project Management Dashboard is delivered as a Figma file, which means it inherits all the advantages of a design system: well-organized layers, named groups, and editable components. Users can modify color schemes to match brand guidelines, replace placeholder avatars with actual team photos, adjust typography using the included free Google Fonts, and rearrange modules to reflect their workflow hierarchy.
The included help guide (a PDF file) and fonts link file (a TXT document) ensure that even users with limited Figma experience can navigate the customization process. For design leads or UI specialists, the structured layer groups allow rapid iteration. For example, a company that uses a custom priority system (Critical, High, Medium, Low, Backlog) can update the badge components in minutes rather than rebuilding the entire dashboard. The fully customizable with easy editing promise is backed by a thoughtful file structure that separates static backgrounds from data-driven components, making it possible to update the dashboard without breaking the overall layout.
Practical Applications Across Team Types and Industries
The versatility of the Prolytic Project Management Dashboard becomes apparent when you consider the range of users who benefit from its design. For productivity application developers, the dashboard serves as a reference interface for building task organization services. The layout demonstrates how to present complex data — task lists, team assignments, deadlines, and progress metrics — in a way that feels intuitive rather than overwhelming. Developers can study the component hierarchy to inform their own UI decisions.
Marketing agencies and creative studios often juggle multiple client projects with varying timelines and deliverables. A dashboard that groups projects by status and allows quick filtering by team member or deadline is invaluable. The Prolytic template’s organized layout supports this use case directly. Instead of flipping between spreadsheets and email threads, a project manager can keep the dashboard visible as a live progress snapshot. The dark mode version is particularly useful for agencies that work late during campaign launches, reducing eye fatigue during extended monitoring sessions.
Educational institutions and research groups manage grant deadlines, publication timelines, and student supervision schedules. These environments benefit from the dashboard’s clarity rather than its flashiness. A principal investigator can track which experiments are on schedule, which datasets are overdue, and how many hours each researcher has allocated to specific tasks. The clean typography and restrained color palette keep the focus on the data, not on decorative elements.
Freelancers and solo creators might wonder whether a multi-user dashboard applies to them. The answer lies in the template’s adaptability. A freelancer can repurpose the team allocation section into a project category tracker, using the same visual framework to monitor multiple client engagements. The progress indicators and timeline components work just as well for a single user as they do for a team of fifty.
Pixel-Perfect Layout and Its Effect on Workflow Trust
Trust is an underappreciated aspect of project management tools. When team members see misaligned elements, inconsistent spacing, or poorly scaled icons, they subconsciously doubt the reliability of the underlying data. A pixel-perfect layout signals attention to detail. The Prolytic Project Management Dashboard maintains consistent padding, balanced grid proportions, and typographic hierarchy throughout both light and dark modes. This consistency builds a sense of professionalism that extends to the team’s perception of the workflow itself.
For example, when a developer looks at a task board where the priority labels are clearly distinguished by color and size, and where the task cards align perfectly within their columns, the interface communicates order. That psychological comfort translates into smoother stand-up meetings and fewer clarification questions about task statuses. The dashboard becomes a shared reference point that everyone reads the same way because the design leaves no room for ambiguous visual signals.
Workflow Systems and the Role of Organized Layouts
Workflow systems thrive on predictability. Whether a team uses Scrum, Kanban, Waterfall, or a hybrid approach, the dashboard should reinforce the chosen methodology without fighting it. The Prolytic template’s layout is methodology-agnostic in the best sense. Its modular structure allows teams to dedicate sections to sprint backlogs, continuous delivery pipelines, or milestone charts without needing to redesign the entire interface. The included components — task cards, progress circles, timeline bars, and team rosters — are the building blocks of virtually any workflow system.
A practical observation from teams that have adopted similar dashboard templates is that the act of customizing the dashboard often reveals inefficiencies in the workflow itself. When you have to decide which metrics to display and how to group them, you are forced to clarify what matters most. The Prolytic file structure facilitates this reflection because it presents a clean slate of well-organized layers rather than a rigid template. Teams can discuss which modules to prioritize and which to hide, and those conversations frequently lead to process improvements that go beyond the interface.
Considerations for Implementation and Adoption
Adopting a new dashboard template involves more than just downloading a file. Teams should consider how the Prolytic Project Management Dashboard fits into their existing tool stack. The template is a design file, not a live application, which means it is best suited for teams that use Figma for prototyping, presentation mockups, or documentation. It can serve as a visual specification for developers building a custom project management tool, or as a high-fidelity wireframe for stakeholder buy-in before committing to a development sprint.
For teams that already use a project management platform like Jira, Asana, or Monday.com, the Prolytic dashboard can function as a supplementary reporting layer. Export the layout as a static image for weekly reports, or use it as a design reference for custom dashboard views within those platforms. The key is to view the template as a design resource that informs your visual standards, not as a replacement for your operational backend.
The note that images shown in previews are for demonstration only and are not included is an important practical consideration. Users should plan to source their own project screenshots, team photos, and data visualizations. The template provides the structural framework, but the content must come from the actual project environment. This separation actually works in the user’s favor: it forces customization from the start, ensuring the final dashboard reflects real project data rather than generic placeholders.
The Broader Trend: Dashboard Design as a Discipline
The Prolytic Project Management Dashboard sits within a larger movement toward design-driven project management. As remote and hybrid work become permanent fixtures, the dashboard is no longer just a tool for managers — it is a communication channel visible to the entire team. A well-designed dashboard reduces the need for status update meetings, email check-ins, and Slack queries. It becomes the single source of truth that everyone checks at the start of the day.
Design choices such as the 1440×1024 resolution, dual-mode interface, and organized layer groups are not arbitrary features. They reflect a deep understanding of how professionals actually use dashboards: on standard screens, for extended periods, and in varied lighting conditions. The emphasis on professional management-focused UI components means that every element serves a functional purpose. There are no decorative flourishes that waste loading time or distract the eye. The aesthetic is clean and modern, but it is a cleanliness that comes from thoughtful prioritization, not from minimalism for its own sake.
For educators teaching project management or UX design, the Prolytic template offers a case study in information architecture. Students can analyze why certain elements are grouped together, why color is used sparingly, and how typography creates a visual hierarchy that guides the viewer from overview to detail. The template is both a practical tool and a teaching resource.
Observations on Long-Term Usability
A dashboard that looks good on day one but becomes cumbersome to update over time will eventually be abandoned. The Prolytic Project Management Dashboard addresses this risk through its Figma-native structure. Named and grouped layers make it easy to return to the file weeks or months later and remember how it is organized. The inclusion of a help guide and font links ensures that institutional knowledge is not lost when the original designer leaves the team. These small but critical details support long-term usability, making the template a viable choice for organizations that plan to refine their dashboards iteratively rather than replace them entirely.
Teams that have used similar templates report that the initial customization takes a few hours, but subsequent updates take minutes. This return on investment is what makes a well-structured design file valuable. The Prolytic dashboard is not a one-time asset; it is a reusable framework that evolves with the team’s needs. As new projects start, team members change, and priorities shift, the dashboard can be updated without starting from scratch.
Final Thoughts on Visual Workflow Intelligence
The Prolytic Project Management Dashboard exemplifies how thoughtful design can transform project oversight from a reactive task into a proactive discipline. By prioritizing clarity, adaptability, and professional consistency, it provides a foundation that teams across industries can tailor to their specific workflows. The combination of light and dark modes, pixel-perfect layout at a standard resolution, and fully customizable Figma components makes it a practical choice for startups, agencies, research groups, and solo practitioners alike. Whether you are building a task management platform from the ground up or simply looking to improve how your team visualizes progress, the design principles embedded in this dashboard offer a reliable roadmap. In a world where work is increasingly distributed and data-rich, having a command center that you can trust — and that your team can read at a glance — is not a luxury. It is a necessity.